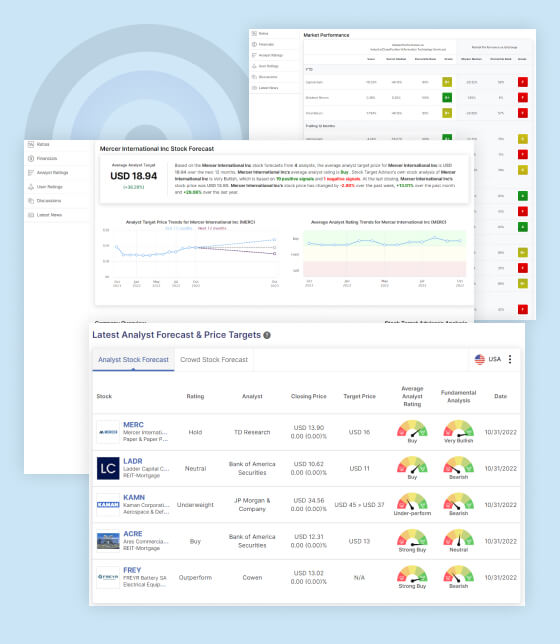
Using charts in technical stock analysis can provide a visual representation of a stock’s price movements over time and help identify patterns and trends that might not be immediately apparent from simply looking at the numbers. Here are some other reasons why STA Research, or anyone, might prefer to use charts in technical stock analysis:
Charting can help identify support and resistance levels: Charts can be used to identify areas where a stock’s price has historically tended to “bounce” off of (support) or struggle to break through (resistance). These levels can be useful in making buy and sell decisions.
Charts can help identify trend lines: Charting can be used to identify trend lines that show the overall direction a stock’s price is moving in. This can help traders and investors to make decisions about whether to buy, sell or hold a stock.
Charting can help identify technical indicators: Charts can be used to plot technical indicators such as moving averages, MACD, RSI, Bollinger Bands, and others. These indicators can help traders and investors to identify potential buy or sell signals.
Charting can help identify patterns: Charts can be used to identify chart patterns such as triangles, head and shoulders, and other patterns that can indicate potential price movements.
Charts can be a powerful tool in technical stock analysis as they can provide a visual representation of price movements, help identify key levels and patterns, and provide insight into potential buy and sell signals.
How to use Stock Charts for Investing Research
- Identify Trends: Stock charts can be used to identify long-term trends in a stock’s price movement. Investors can use this information to determine whether a stock is in an uptrend or downtrend, and whether it is a good time to buy or sell.
- Analyze Support and Resistance Levels: Support and resistance levels are areas on a chart where the stock’s price has previously bounced off. Investors can use these levels to help determine when to buy or sell a stock.
- Use Technical Indicators: Technical indicators are mathematical calculations that use stock price and volume data to help identify buying and selling opportunities. Examples of technical indicators include moving averages, Relative Strength Index (RSI), and MACD.
- Identify Patterns: Stock charts can also be used to identify patterns such as head and shoulders, double tops, and double bottoms. These patterns can provide clues about a stock’s future price movement.
- Use Multiple Timeframes: Investors can use charts with different timeframes (daily, weekly, monthly) to get a better understanding of a stock’s overall trend. Short-term traders may use daily charts, while long-term investors may use monthly charts.
- Compare Stocks: Investors can use charts to compare the performance of different stocks or indexes. This can help identify which stocks are outperforming or underperforming the market.
What are the Downsides of Using Charts for Stocks?
- Overemphasis on Short-term Trends: Charts are often used to identify short-term trends in a stock’s performance, which can be helpful in making short-term trading decisions. However, this focus on short-term trends can lead investors to overlook important long-term factors that could impact a stock’s performance over time.
- Misinterpretation: Charts can be complex and difficult to read, and there is a risk of misinterpreting the information they present. Investors may see what they want to see in a chart, rather than objectively evaluating the data.
- Limited Information: Charts only provide a limited amount of information, and they may not capture all of the factors that can impact a stock’s performance. Investors should also consider fundamental factors such as a company’s financials, management, and competitive landscape.
- False Sense of Security: Investors may rely too heavily on charts and become overconfident in their ability to predict a stock’s performance. This can lead to making rash decisions and taking on unnecessary risks.
- Market Manipulation: Charts can be manipulated by large traders and institutions, leading to false signals and misinterpretation. Investors should be wary of relying too heavily on charts without considering other factors and conducting thorough research.
Summarizing Chart Usage
While charts can be a useful tool for analyzing stocks, investors should be cautious about relying too heavily on them. It’s important to consider fundamental factors and conduct thorough research before making investment decisions. Charts should be used in conjunction with other analysis tools to make informed decisions about buying and selling stocks.


