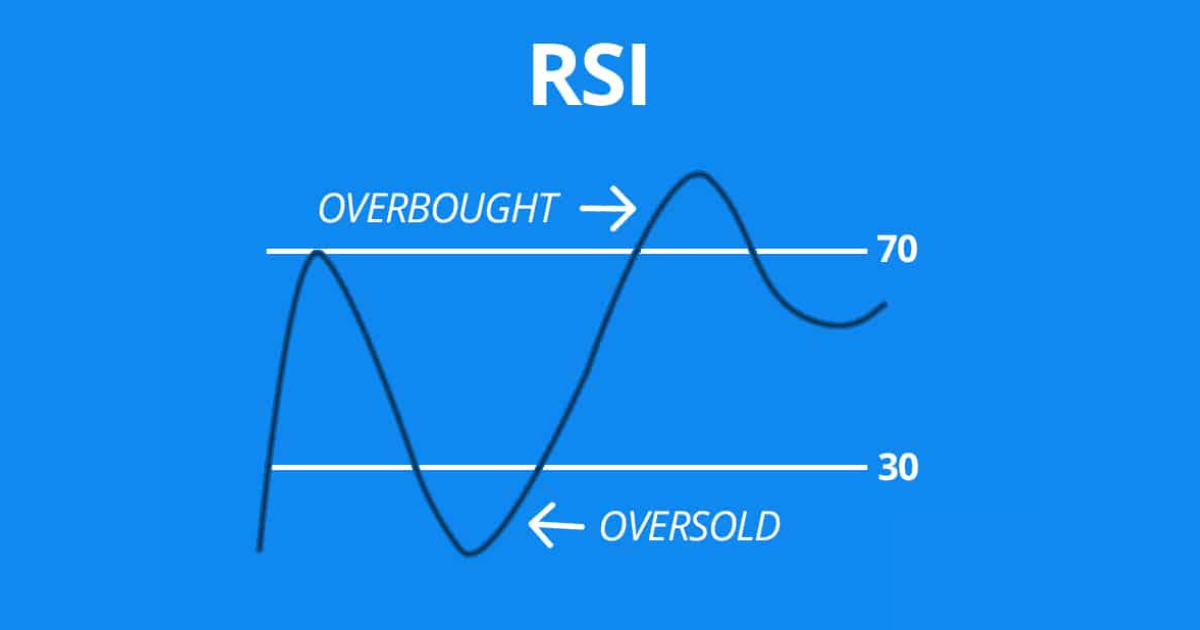
The Relative Strength Index (RSI) is a technical momentum indicator used to evaluate whether a security is overbought or oversold. Developed by J Welles Wilder, the RSI oscillates between two extreme levels, providing a visual representation of a stock’s price movement.
To use the RSI, the scale ranges from 0 to 100, with an RSI reading of 70 or more indicating that the security is overbought, while an RSI reading of 30 or less indicates that the security is oversold. A stock is considered overbought when more buyers exist than sellers, causing the stock price and volume to increase. Conversely, a stock is considered oversold when more sellers exist than buyers, leading to a rapid decline in the stock’s price.
It is essential to note that using the RSI indicator alone to make buy or sell decisions may not be the best approach. Using the RSI in conjunction with other technical indicators can help investors make better decisions.
The most popular period used to study a stock’s price movement is a 14-day RSI. However, investors can adjust the RSI level to provide a better view of the security’s price movement.
It is crucial to recognize that the RSI may remain in overbought or oversold territory for extended periods during strong trends. During bear markets, an overbought RSI reading may be below 70, while an oversold RSI reading may be above 30 during bull markets.
In conclusion, the RSI is an essential tool for identifying overbought and oversold securities. By using the RSI in conjunction with other technical indicators and understanding its limitations, investors can make more informed decisions when investing in the stock market.