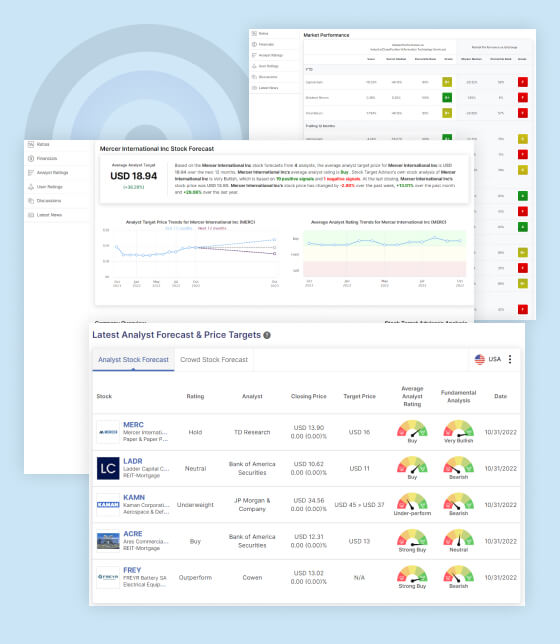
Analysts rate Bed Bath & Beyond Inc with an Underperform rating and a 12-month average target price of $9.13 per share.
Yesterday Morgan Stanley maintained Bed Bath & Beyond Inc with an Underperform rating and slashed the target price to $2 from $7 on the company’s stock.
B. Riley lowered the target price on Bed Bath & Beyond Inc to $5 from $7 while maintaining the Neutral rating.
Based on the Bed Bath & Beyond Inc stock forecasts from 12 analysts, the average analyst target price for Bed Bath & Beyond Inc is USD 9.13 over the next 12 months. Bed Bath & Beyond Inc’s average analyst rating is Under-perform. Stock Target Advisor’s own stock analysis of Bed Bath & Beyond Inc is Bearish, which is based on 2 positive signals and 12 negative signals. At the last closing, Bed Bath & Beyond Inc’s stock price was USD 4.97. Bed Bath & Beyond Inc’s stock price has changed by -30.29% over the past week, -46.15% over the past month and -85.07% over the last year.
This week, as the stock plummets in the wake of a dismal quarter of profits and the resignation of the CEO, analysts are pessimistic about the future of Bed Bath & Beyond.
As of 11:25 a.m. ET, shares have decreased by 23 percent over the last two days from Tuesday’s close of $6.53 to $5.01. The retailer’s latest decline follows a weak first quarter and the declaration that CEO Mark Tritton would step down from his post. Bed Bath & Beyond stated in an earnings release that the company struggled due to rising inflation, low customer confidence, and low demand for home items. The company recorded nearly $357 million in net losses for the first quarter.
What we like:
Positive cash flow
The company had positive total cash flow in the most recent four quarters.
Positive free cash flow
The company had positive total free cash flow in the most recent four quarters.
What we don’t like:
Low market capitalization
This is among the smaller entities in its sectors with below median market capitalization. That may make it less stable in the long run unless it has a unique technology or market which can help it grow or get acquired in future.
Poor risk adjusted returns
This company is delivering below median risk adjusted returns in its peers. Even if it is outperforming on returns , the returns are unpredictable. Proceed with caution.
High volatility
The total returns for this company are volatile and above median for its sector over the past 5 years. Make sure you have the risk tolerance for investing in such stock.
Below median dividend returns
The company’s average income yield over the past 5 years has been low compared to its peers. However, it is not a problem if you are not looking for income.
Overpriced compared to earnings
The stock is trading high compared to its peers on a price to earning basis and is above the sector median.
Overpriced compared to book value
The stock is trading high compared to its peers median on a price to book value basis.
Overpriced on cashflow basis
The stock is trading high compared to its peers on a price to cash flow basis. It is priced above the median for its sectors. Proceed with caution if you are considering to buy.
Highly leveraged
The company is in the bottom half compared to its sector peers on debt to equity and is highly leveraged. However, do check the news and look at its sector and management statements. Sometimes this is high because the company is trying to grow aggressively.
Overpriced on free cash flow basis
The stock is trading high compared to its peers on a price to free cash flow basis. It is priced above the median for its sectors. Proceed with caution if you are considering to buy.
Low Earnings Growth
This stock has shown below median earnings growth in the previous 5 years compared to its sector
Low Revenue Growth
This stock has shown below median revenue growth in the previous 5 years compared to its sector
Low Dividend Growth
This stock has shown below median dividend growth in the previous 5 years compared to its sector.